Publications & Posters
Serum Neurofilament Light Chain is Increased in Hereditary Spastic Paraplegias
ANNALS OF CLINICAL AND TRANSLATIONAL NEUROLOGY
Wilke C, Rattay Tim W, Hengel H, Zimmermann M, Brockmann K, Schöls L, Kuhle J, Schüle R and Synofzik M
Ann Clin Transl Neurol. 2018 May 21;5(7):876-882
DOI: 10.1002/acn3.583. eCollection 2018 Jul.
This study was peformed using a Simoa® Homebrew assay.
Abstract
Blood biomarkers are still largely missing in hereditary spastic paraplegias (HSPs). We here explored Neurofilament light chain (NfL) as a biomarker in HSP. Serum NfL was assessed in 96 HSP (63 genetically confirmed), 96 healthy control, and 33 ALS subjects by single molecule array (Simoa). Compared to controls, NfL was increased in HSP (P < 0.001), correlating with cross-sectional disease progression (ρ= 0.28). Levels were lower than in ALS (P < 0.001), allowing to differentiate HSP from ALS (AUC = 0.91). Serum NfL might serve as a biomarker in HSP indicating neuronal damage and, if confirmed longitudinally, disease progression. It might also support differentiating HSP from ALS.
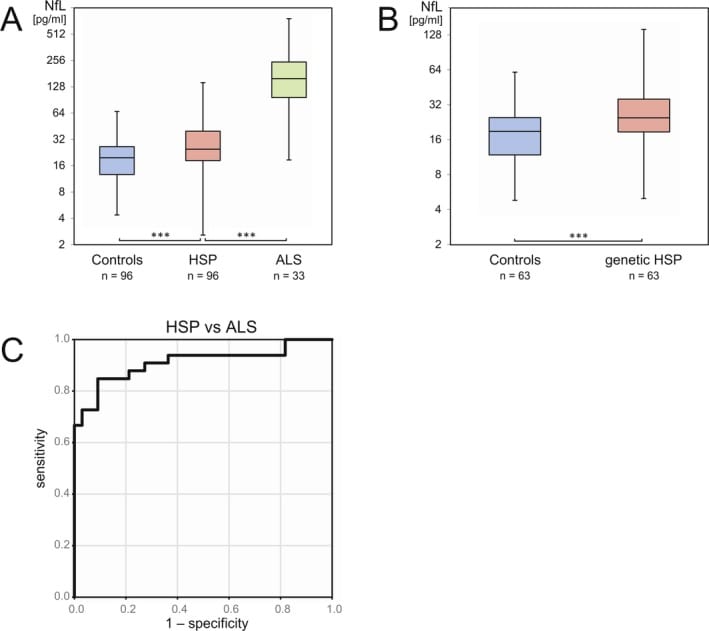
Serum neurofilament light chain (NfL) levels are increased in hereditary spastic paraplegias (HSPs), in an intermediate range still distinguishable from amyotrophic lateral sclerosis (ALS). Panel (A) illustrates serum NfL concentrations (pg/mL) in the overall HSP patient group, their age‐matched healthy controls, and a cohort of ALS patients. Panel (B) illustrates NfL levels in the subset of genetically confirmed HSP patients in comparison to their a priori age‐matched controls. In the boxplots, central horizontal lines indicate median values, boxes illustrate the ranges between lower and upper quartiles, and error bars represent the full ranges of data. ***P < 0.001. Please note the logarithmic scale of the y‐axis. The receiver operating characteristics (ROC) curve illustrates sensitivity and specificity of serum NfL for differentiating HSP patients from ALS patients (C). The area under the curve (AUC) was used as a parameter to summarize the biomarker performance (AUC = 0.91 (0.84–0.99), mean and 95% confidence interval of the mean).